2018, reviewed: Another top-5 warm year, and more numbers

Despite January’s frigid start, 2018 landed within the top-five warmest years on record at the airport, tying 1998 with an average temperature of 67.9°. This is the fourth consecutive year that average temperatures have landed within the top five warmest on record. 1990 still reigns supreme, though, as the warmest recorded year with an average temperature of 69.3°.
Data for this post is sourced from a compilation of records by the Southeast Regional Climate Center as well as the National Weather Service forecast office in Charleston, SC. Records at the North Charleston climate site begin in 1938.
Some other notable temperature tidbits from 2018:
- The first week of 2018 was the coldest seven-day stretch of weather on record at the airport. The average temperature from January 1 to January 7 was 27.3°. The previous coldest seven-day stretch was from January 17-January 23, 1977, when the average temperature was 29.4°.
- Conversely, February 2018 was the warmest February on record for the second consecutive year. It wasn’t close, either: With an average temperature of 62.0°, it blew away the previous record high of 59.4°, set in 2017.
- Summer 2018 was the eighth warmest on record with an average temperature of 82.3°. Summer 2016, with its average temperature of 84.1°, reigns supreme.
- June 20 was the hottest day of the year. The average temperature was 87.5° thanks to a high of 97° and a low of 78°.
- Fall 2018 (September 1-November 30) was the second warmest on record with an average temperature of 70.4°. Only the fall of 1985 was warmer, with an average temperature of 71.7°.
- October 5’s high of 93° is good for third-warmest October day on record. The warmest: October 5, 1986 and October 5, 1954 — both days reached 94°.
- October 17’s high of 90° tied the latest 90°+ temperature on record at the airport. This was first achieved on October 17, 1972, when it was 91°.
Precipitation
Source: National Weather Service, Charleston, SC Weather Forecast Office
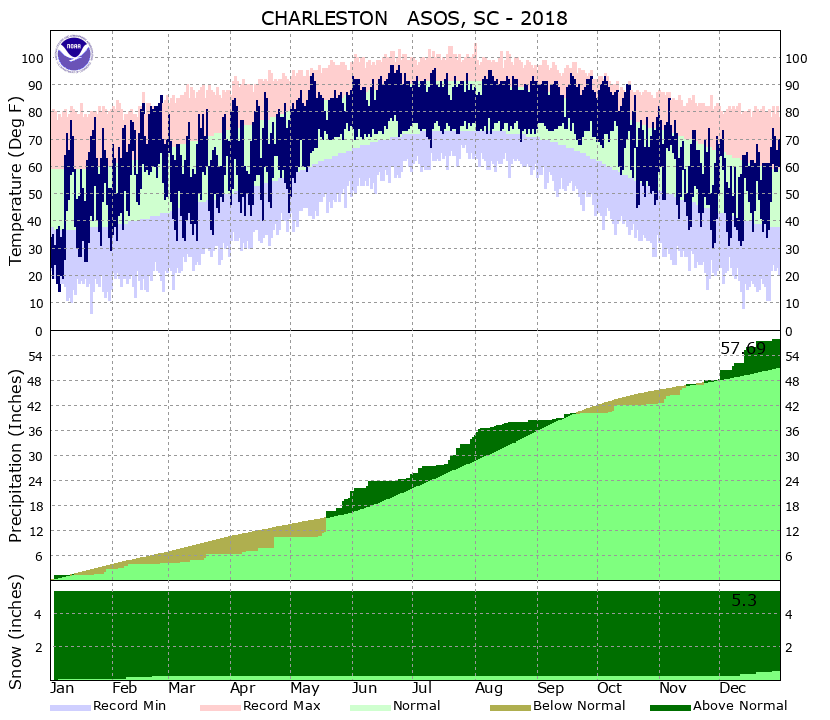
The Charleston area started the year in moderate drought. This quickly changed in mid-May as a period of very heavy rain inundated the Charleston area, sending rainfall well above normal and keeping it there through the summer. We started to slip back into drought as we got into September and October (despite two tropical systems!) before ending the year on a very wet note.
Some precipitation numbers:
- May’s 10.62″ of rain was not only good for being the wettest month of the year, but also for being the wettest May on record.
- December’s 9.75″ of rain made for a soggy finish to the year, and the third-wettest December on record.
- 2018’s total rainfall of 57.69″ is good for 20th wettest on record. (Hopefully we don’t approach 2015’s record of 74.69″ anytime soon.)
- Spring 2018 (March 1-May 31) was the eighth wettest on record, with 16.96″ of rain at the airport.
- Purely on the strength of the January 3rd winter storm, 2018 was the third-snowiest on record with 5.3″ at the airport.
Trends
Temperatures

Yes, it’s getting warmer, both locally and around the globe. Since 1938, the trend in average temperature has been undeniably upward, ticking up some 2.5° when looking at the regression line above. As mentioned earlier, for the fourth consecutive year, we have set another top-five temperature record.

This warmth has had impacts on energy bills. (So has a certain nuclear plant, but that’s beside the point.) Looking at cooling degree days, which sums how many degrees the average temperature exceeds 65°, you’ll see that we’ve set two record highs in the last three years. In fact, 2018’s CDD value of 2920 is second only to 2016’s 2965. This has real economic and infrastructure impact, and is something to watch closely, especially as we plan resilience efforts to impacts from climate change.
Precipitation

Precipitation trends are less clear. Any attempt at calculating average is going to be skewed wildly by 2015, so it is hard to extrapolate from here. For what it’s worth, removing 2015 shows a much flatter trend as far as precipitation goes.
Generally speaking, a normal year of precipitation in Charleston is around 51.03″ of rain; with 57.69″ in 2018 (driven largely by the excessively wet months of May and December), we exceeded that average, and have done so every year since 2013.
It’s also important to note that when looking at one climate site for precipitation, it won’t tell the whole story — that’s just a point. Many places got much more rain than the airport this year, such as CoCoRaHS station SC-CR-87, which received a very impressive 75.87″ in 2018.
While it is nearly impossible to predict with certainty what 2019 holds, we’ll want to watch temperatures and any possible link to enhanced or lowered precipitation totals closely this year and in the years to come.