Using weather radar to discern between a sonic boom or a quake (sometimes)
On Friday, Twitter lit up with reports of a boom that was felt in James Island and West Ashley. (I felt it too, which is unusual since I am typically oblivious to such things.)
Whenever I get reports like this, the first place I go is to USGS’s earthquakes map. Typically, when the jolt is strong enough for us to feel and it was seismic, there’s going to be something here pretty quickly. On this day, there was nothing on USGS.
The other type of jolt we feel most often around here are sonic booms, which occur as the result of trailing shockwaves from supersonic aircraft. Since the Concorde has been retired, that leaves military aircraft conducting exercises as the prime source of said booms. And sometimes, we can use weather radar to see some byproducts of these exercises, called chaff. This was the case on Friday morning with a chaff release very near the time of the sonic boom, giving increased confidence in our inference of the source of the boom.
It’s worth noting that not every sonic boom will be accompanied by a chaff release. However, when the shaking and then the chaff release happen within a reasonable amount of time from each other, it lends quite a bit of confidence in the sonic boom being the source of the shaking rather than anything seismic. This method is not foolproof, though.
Why is there chaff here?
Military aircraft release chaff, typically very thin fibers of aluminum, as a countermeasure to fool enemy radars. (The Wikipedia page for chaff provides a nice dive on the history of its use in warfare.) The goal is to cause false targets to show up, disguising the actual position of the aircraft on radar. Chaff releases are very common in our area given the proximity to two Air Force bases (Charleston and Shaw) and the Marine Corps Air Station in Beaufort. And, after all, they’ve gotta practice and stay sharp, just in case.
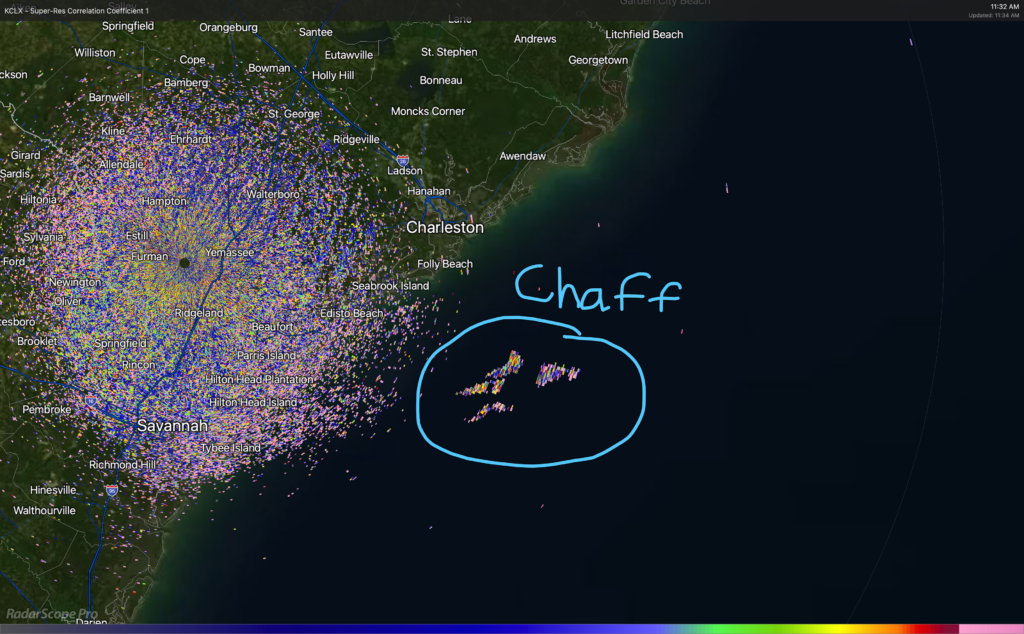
So, when there are exercises going on, the weather nerds tend to know about it because of the chaff releases. Take a look at this chaff release from Friday morning and how much it resembles precipitation echoes:
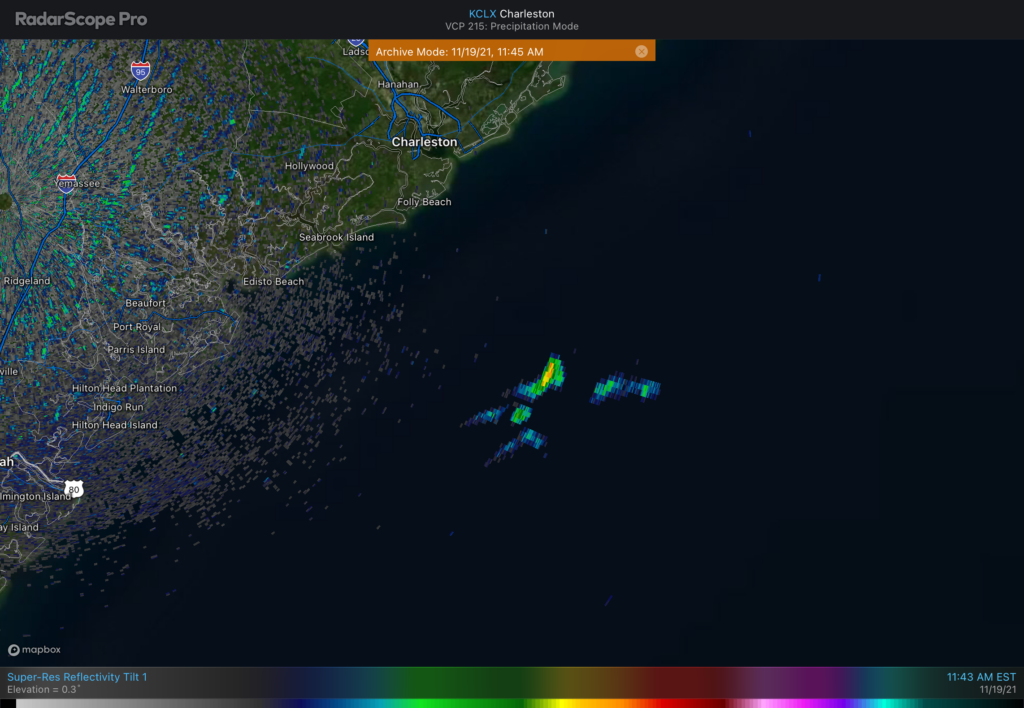
This chaff release from Friday was dense in a couple spots, which in turn increases the reflectivity back to the radar, and making it look like there were showers over the Atlantic with some embedded downpours. This chaff release was moving southeastward, caught well within deep northwest flow in the wake of a cold front.
But how do we know that this is chaff? One clue is that there were no clouds in the area. To have precipitation…well…you need clouds, and satellite was clear well off our coast Friday morning:
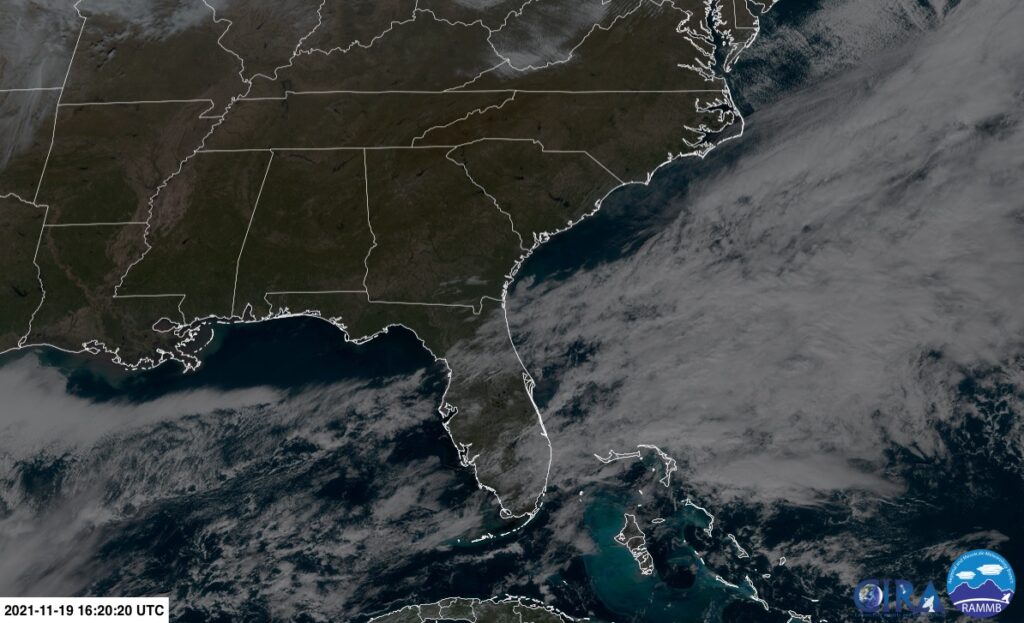
If a cloud bank had been present, though, that would make this a little less clear-cut. While the presence of chaff can also be inferred by its motion and behavior (it has a tendency to spread out over time), we have another tool at our disposal thanks to the dual-polarization capability of the WSR-88D weather radar.
Dual-polarized radars send out a horizontal and a vertical pulse to not only ascertain the density and motion of a target, but also the target’s shape. This is tremendously helpful for so many meteorological applications — discerning changeover from rain to snow, estimating hail size, and detecting tornado debris, just to name a few. It also helps us discern what’s rain and what’s not, and that’s especially helpful here in our neck of the woods, where sometimes military exercises and inclement weather can coincide.
Correlation Coefficient helps us separate the “wheat” from the chaff
A quick, go-to product for determining whether radar echoes are meteorological is the Correlation Coefficient product. In short, it gives the radar operator an indication of how alike targets are within the radar beam. The more uniform the targets, the more likely they are to be meteorological in nature. On the other end of the spectrum, if the target shapes vary wildly within said beam, then it is likely that the radar is bouncing off non-meteorological targets.
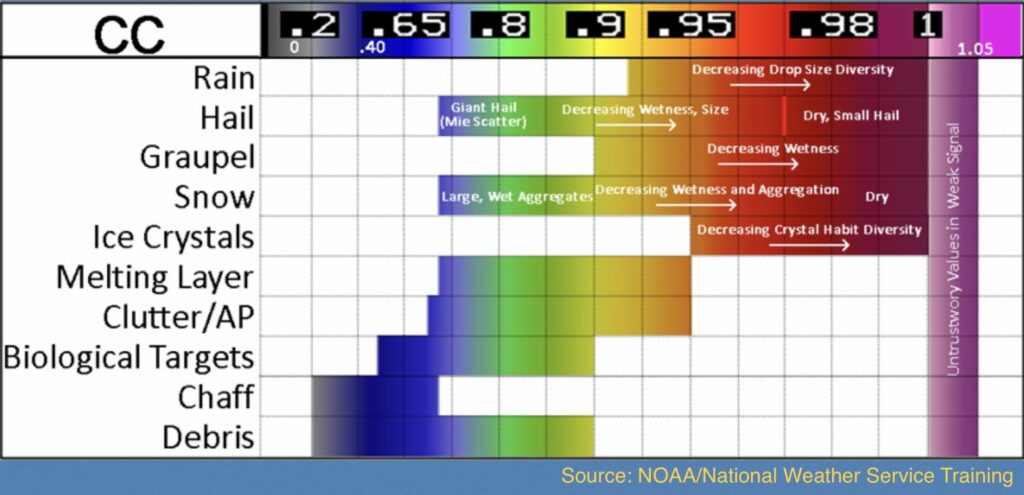
The chart above shows the typical correlation coefficient values for various targets on a scale from 0-1. Meteorological targets tend to range from about .7 to 1; the lower the number, the more mixed the target sizes. Non-meteorological targets, such as biologicals, chaff, and debris tend to go much lower, closer to .2.
Armed with this knowledge, let’s put the Correlation Coefficient product next to the reflectivity product from Friday morning:
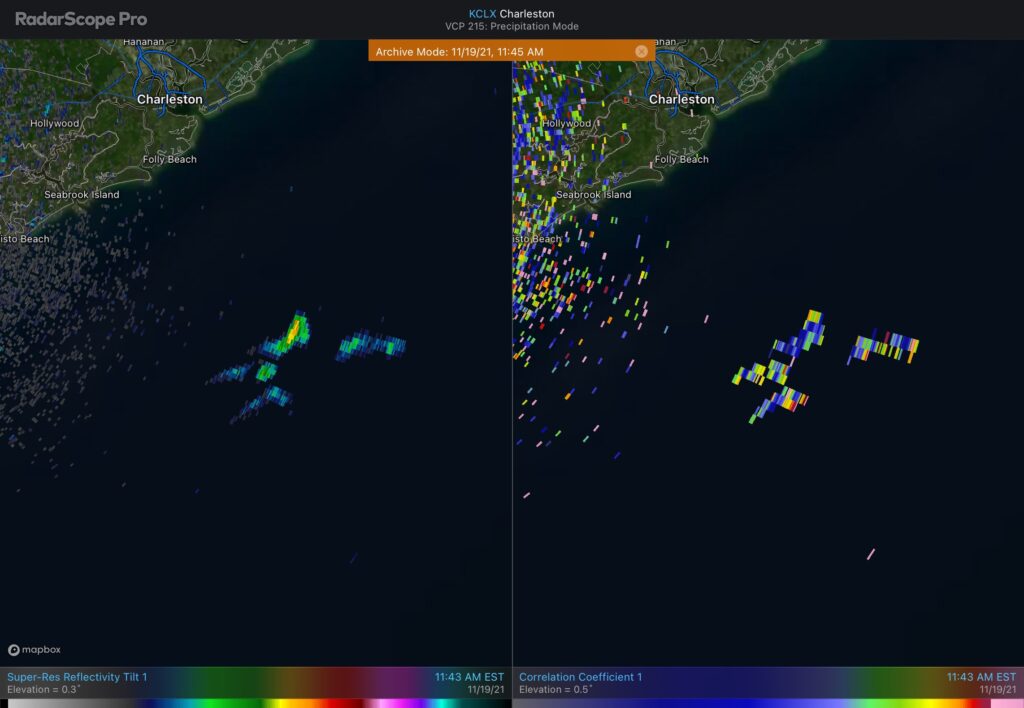
The standard reflectivity product remains on the left, with the correlation coefficient product on the right. You’ll notice quite a bit of blue and gray associated with the returns over the Atlantic, which indicates very differently-shaped targets. Contrast this with some legitimate shower activity in a similar location off the coast Saturday afternoon:
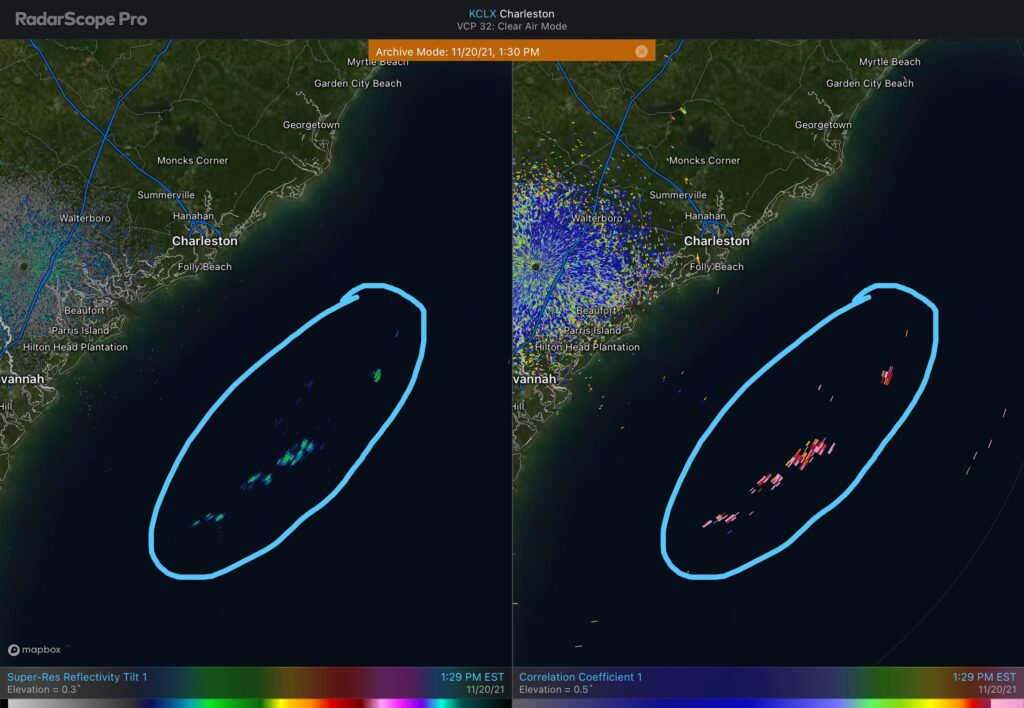
While these are fairly weak returns, we see quite a bit more in the way of higher correlation coefficient values with this activity, giving the radar operator confidence that these are, indeed, light showers well off the coast. (You’ll also see the much lower correlation coefficient values over land, related to where the radar is picking up on ground clutter.)
Other examples of chaff releases
Some chaff releases are quite, quite dense. Here’s an example from April 27, 2021 that lasted well into the next day:
You’ll see how the chaff tends to linger and spread out over time. (There’s another burst of chaff toward the end of the loop, too.) It’s very clearly chaff given the very low correlation coefficient values (all the blue and gray in the right panel).
As I mentioned before, this chaff lasted a long time. Vertically-stacked high pressure kept winds relatively light through the lower levels of the atmosphere, which allowed this stuff to hang around. Here’s the surface and 850 millibar analyses from the night of the 27th (the 28th in Zulu time) which indicate the relatively calm winds and high pressure:
Here’s another example of chaff mixing in with rain from a week earlier on April 20:
At first glance on reflectivity, it sure looked like new showers were developing to the northeast of the stationary activity offshore! Correlation Coefficient gives us the goods, though, on what’s rain and what’s not — just incredibly helpful for a radar operator.
The bottom line on chaff, shakes, and quakes
- Chaff releases are common during military exercises, which are in turn common in our neck of the woods. Weather radar can pick up on them, just like any other radar system the chaff is designed to jam.
- A chaff release near the time of quick shaking at the surface can be a really good indicator that a sonic boom, and not seismic activity, was the source of the shaking.
- Earthquakes can and do happen here, but are more rare than these sonic booms. They’ll also tend to be a little longer-lasting of a rumble, and will typically show up quickly on USGS’s website if they’re felt widely enough.
Have any more questions? Hit me up on Twitter! I love to talk radar interpretation and may even do another one of these posts at some point.
Follow my Charleston Weather updates on Mastodon, Bluesky, Instagram, Facebook, or directly in a feed reader. Do you like what you see here? Please consider supporting my independent, hype-averse weather journalism and become a supporter on Patreon for a broader look at all things #chswx!